$INTU (+1.2%) | Intuit Q1 Earnings Highlights:
🔹 Adjusted EPS: $2.50 (Est. $2.35) 🟢
🔹 Revenue: $3.28B (Est. $3.14B) 🟢; UP +10% YoY
Q2 Guidance:
🔹 Revenue: $3.81B-$3.85B (Est. $3.88B) 🔴; UP +13-14% YoY
🔹 Adjusted EPS: $2.55-$2.61 (Est. $3.25) 🔴
FY25 Guidance:
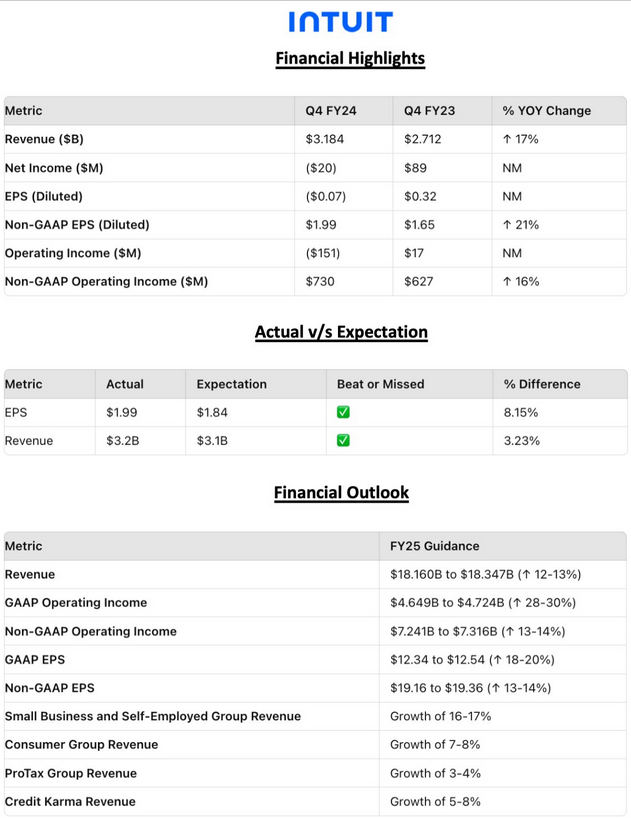
🔹 Revenue: $18.16B-$18.35B (Est. $18.26B) 🟡; UP +12-13% YoY
🔹 Non-GAAP Operating Income: $7.24B-$7.32B; UP +13-14% YoY
🔹 Non-GAAP EPS: $19.16-$19.36; UP +13-14% YoY
OTHER Q1 METRICS:
🔹 Service Revenue: $2.89B
🔹 Product/Other Revenue: $394M
🔹 GAAP Net Income: $197M; DOWN -18% YoY
🔹 Non-GAAP Operating Income: $953M; DOWN -1% YoY
🔹 R&D Expenses: $704M (Est. $722.6M) 🟡
Q1 SEGMENTS:
Global Business Solutions Group:
🔹 Revenue: $2.50B; UP +9% YoY
🔹 Online Ecosystem Revenue: $1.90B (Est. $1.97B) 🔴; UP +20% YoY
🔹 Desktop Ecosystem Revenue: $480M (Est. $580.7M) 🔴; DOWN -17% YoY
🔸 Credit Karma Revenue: $524M (Est. $430M) 🟢; UP +29% YoY
🔸 Consumer Group Revenue: $176M (Est. $168.6M) 🟢; DOWN -6% YoY
🔸 ProTax Group Revenue: $39M (Est. $37.6M) 🟡; DOWN -7% YoY
Profitability Metrics:
🔹 GAAP Operating Income: $271M; DOWN -12% YoY
🔹 GAAP EPS: $0.70; DOWN -18% YoY
🔹 Non-GAAP Operating Margin: 29.0% (Est. 28.6%) 🟡
Cash Flow and Balance Sheet:
🔹 Cash & Investments: $3.4B
🔹 Total Debt: $6.1B
🔹 Share Repurchases: $570M
🔹 Quarterly Dividend: $1.04 per share (+16% YoY)
Management Commentary:
🔸 CEO Sasan Goodarzi:
"We've had a strong start to the year as we demonstrate the power of Intuit's AI-driven expert platform strategy. By delivering 'done-for-you' experiences enabled by AI, we continue to fuel the success of consumers and businesses."
