What do you think of $6861 (+2.56%) ? They are on the move in numerous "future sectors", but in my portfolio they have been bobbing around at plus minus 0 for years.

Keyence
Price
Discussion about 6861
Posts
11What an exciting 4 weeks.
My Best Shares:
$TUP +600% ( especially the last 2 weeks).
$RR. (+0.79%) +31,39 %
$VBK (+1.11%) + 19,75 %
Not so well run:
$NB2 (+1.96%) -27.39% (risk position still up 10%)
$6861 (+2.56%) -11.55% ( thus only just above the purchase)
$HIMS (-0.88%) -10.95% (still thickly around plus, profit already taken)

Investment philosophy, "diversification" and dividends
Hi all, as this is my first slightly larger post I would generally appreciate some constructive feedback.
First something About Me
I'll be 22 in a month and I've been active in the stock market for about 2 years now. After a lot of back and forth, I can almost say that I have tried every strategy - but I never really felt comfortable. One learns from mistakes, and I have made many of them.
But what I have also done is to spend countless hours, days and weeks with books, videos, shareholder letters and internet research. I was particularly fascinated by the investment approaches of Terry Smith and the way of Joseph Carlson on Youtube.
My goal quickly became clear, I don't want to have thousands of companies in my portfolio that I don't know, understand or fully support. So an ETF focus was off the table.
Thereupon I built my own investment philosophy, which I would like to present to you in the following.
If you want to know more about me and my goals, there might be another article with a portfolio presentation soon :-)
First I would like to explain to you why I do not believe in diversification hold:
A quote from Warren Buffet is well known: "Diversification is protection against ignorance. It makes little sense if you know what you are doing."
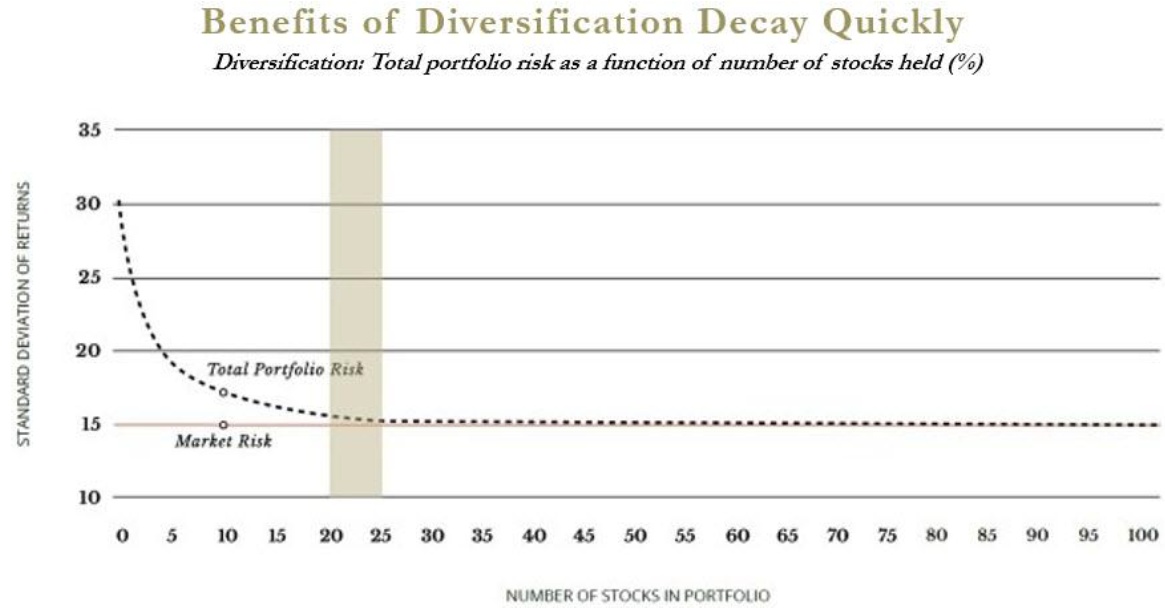
However, a quote from one of the world's best investors alone is unlikely to convince everyone. Studies also support Buffet's view. The advantages of diversification decrease very fast and the gap between market risk and total portfolio becomes minimal from a portfolio size of 20-25 companies - 25 companies give you all the advantages of diversification, more positions only worsen your performance and overview. (Figure 1)
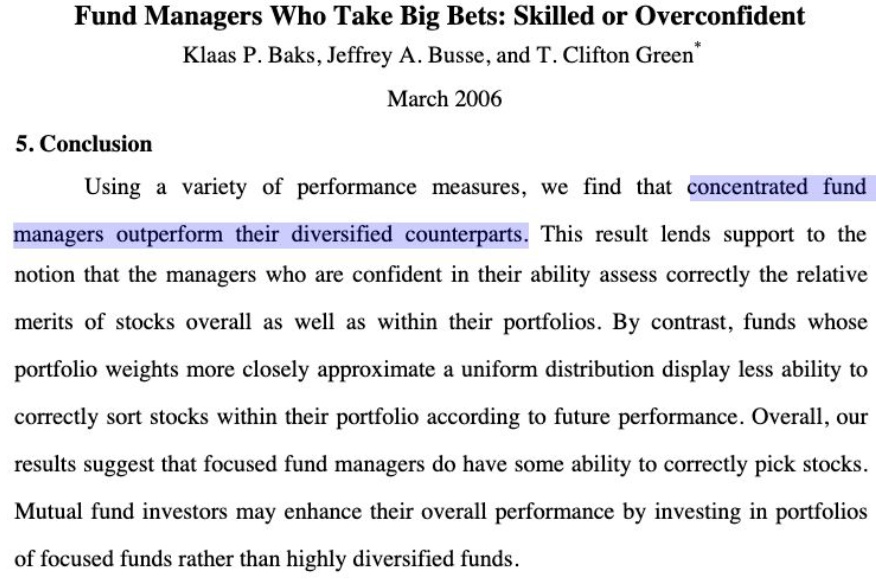
Because concentration delivers better performance. Fund managers who concentrate their knowledge in a few companies deliver better results than more diversified managers. (Figure 2)
Investment philosophy
I want to outperform the market, so I look for the best companies. What makes good companies?
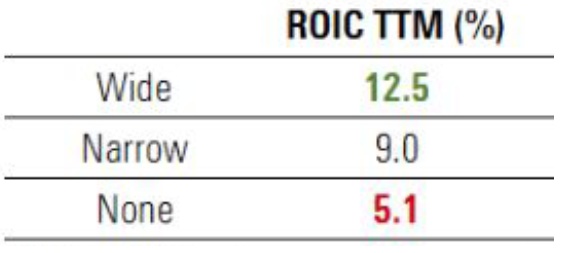
Companies with competitive advantages (moats) outperform the market (Figure 3), and they do so because they have high returns on capital. My first metric for evaluating quality of a company and with a high value in my company analysis is ROIC (Return on Capital Invested). I look for companies with at least 10% ROIC. (Figure 4) Furthermore I want high ROCE (Return on capital employed) and high ROA (Return on Assets) figures.
This directly eliminates some companies and also whole sectors, namely exactly those in which it is not worth to invest anyway. Why is this so?
There are sectors that historically outperform the market (Software, Consumer, Healthcare) - on which my focus is -, and sectors that consistently underperform and are not considered in my investment approach (Banking, Energy, Insurance, Mining, Utilities, Airlines) - just compare the sectors with the main index ;-)
Consumer goods, healthcare and software companies perform better because they generate sustained profits, so they remain profitable even during economic downturns. This allows for consistently high returns on capital.
Next, a look at the margin here I would like to see high Gross Margins >60%, which are also a good indicator of a competitive advantage, and a high Profit Margin, which is an indicator of the efficiency of a company's value creation. However, the most important margin for assessing profitability is the FCF margin.
A company's focus should be maximally on Free Cash Flow, we should invest in companies that are as profitable as possible. In the long run, the share price follows the Fcf/Share.
Beyond that I don't want any debt, any company with Debt/EBITDA > 3 flies right out, preferably anything less than 2.
In terms of growth, I look for stable and good EPS and revenue growth, but FCF growth has the highest priority.
The higher the better, the more important the key performance indicators are.
My minimum benchmarks for the most important metrics:
- ROIC > 15%, ROCE > 15-0%
- Gross Margin > 60%
- Profit Margin > 20%
- FCF Margin > 20%
- Debt / EBITDA < 3, preferably < 1
- FCF 5Y CAGR > 10-15%
(Not all of my companies always meet every metric, but I have built my own score where a minimum score must be met and by score I set the "Conviction" to a company).
Buy & Hold and long-term investing outperforms
As long as a company continues to reinvest its capital at high returns there is no reason to sell. (Figure 5)
What about dividends?
Some of my companies pay a dividend, others don't - I don't put much emphasis on dividends, and will definitely not put bad companies in my portfolio just to get a payout in a given month ;) Dividends should be minimized if capital can be reinvested at high rates of return. At my young age and with a long term investment horizon the focus should be on yield, in old age I will also shift to dividends ;)
The most important thing to conclude: Invest in profitable companies that you UNDERSTAND
A few final tips:
- Don't chase trends, they fade away
- Do not be blinded by dividends
- Don't care about macroeconomics, invest in companies - not cycles
- Market timing is impossible
- Look for established companies, not one-hit wonders
- BUY GOOD COMPANIES - DON'T OVERPAY - DO NOTHING (Terry Smith)
My current investable universe:
$ADBE (-3.15%)
$NVO (-0.35%)
$CUV (-0.22%)
$CDNS (-0.11%)
$ASML (-1.43%)
$VRTX (-0.43%)
$V (-1.41%)
$MA (-2.03%)
$MSFT (-0.88%)
$QLYS (+1.2%)
$MKTX (-1.57%)
$KLAC (+0.85%)
$GOOGL (-0.59%)
$REG1V (-1.82%)
$TNE (+0.28%)
$ENX (-2.32%)
$EW (-0.18%)
$VRSN (-2.37%)
$FICO (-2.36%)
$FTNT (-0.9%)
$NEM (+1.97%)
$MONC (+0.34%)
$CSU (-1.11%)
$6861 (+2.56%)
$ENGH (-1.37%)
$MC (+0%)
$AAPL (-1.69%)
$6857 (+6.25%)
$7741 (+3.22%)
$PAYX (-0.17%)
$MTD (-1.97%)
$TXN (+1.23%)
$OR (-0.95%)
$ZTS (-0.33%) (Companies I watch, in my portfolio I have only 8 of them).
That's it from me for now. Please leave me some feedback and share the post if you like it :-)
What would you like to hear from me next? More about free cash flow? Portfolio presentation? Company presentation? My slightly different valuation approach, far away from P/E?
Some of the illustrations are from a slightly smaller fund ("Long Equity Investing" on Twitter - can only recommend you) or from Terry Smith's Shareholder Letter.
No investment advice
+ 1

February went well. Double-digit growth in equities and EFTs.
Tops:
$HIMS (-0.88%) +39,95%
$RR. (+0.79%) +36,80%
$TMV (+1.1%) +20,00 %
Flops:
$GOOGL (-0.59%) -6,32%
$FRE (+0.31%) -4,23%
$6861 (+2.56%) -2,25%
These 3 values are all in the "expand" range, so it is called cheaper shopping, which is also good.
The week is over, was not so stupid.
Who wants to know it more exactly. Here are the tops and less tops...
$NB2 (+1.96%) +64,21%
$ (-0.88%)HIMS (-0.88%) +19,79%
$6861 (+2.56%) +9,94% because of your YT @BASS-T ? :)
$MRK (-0.26%) -4,07 %
$PEP (-2.49%) -3,90 %
$WM (-0.02%) -2,68%
Bitcoin and Ethereum up 10% and 12% respectively, but I'm not counting them here.
ANALYSIS KEYENCE CORPORATION $6861 (+2.56%)
Key or shotty stock for my dividend portfolio? The top 5 Japan companies in quickcheck
Today, according to the last poll from the beginning of the month, it will be about Keyence. A company of the currently 2nd richest Japanese in the world Takemitsu Takizaki (see (17)).
Before we start, as always, my disclaimer.
Disclaimer: This is not investment advice. It is also not a solicitation to buy and/or sell financial products. I only describe my personal opinion here. You have your own responsibility towards your investments. Therefore no liability.
To get an overview of the company Keyence I use the following outline.
PART 1
Keyence in facts, figures and data
Keyence's business areas, products and fundamental situation
PART 2
The Keyence share - a Japanese giant?
PART 3
Keyence in Japan
Japan - a nightmare for ETF investors?
Opportunities and risks of Keyence's industry
As some of you have noticed, in the future I will split my posts when they reach a certain length. In this case, Part 1 will include the first chapter, Part 2 will include the second chapter, and so on. This is in this form still relatively easy to divide, but in the future may require 2-4 parts depending on the topic. Since this is my last post for now, I will look at the feedback and decide on my future here on Getquin. It is ultimately a simple effort-benefit estimate.
Enough about me and this sorry GIF topic. We will now start with Keyence's Japanese market to get a first look at the group's market environment. Some people make the mistake to look at stocks only from a global perspective and to try to show the profitability and valuation of groups by means of rules of thumb. In my view, however, this is only one part of many that make up a whole puzzle. I will evaluate KEYENCE first from a fundamental-balance sheet point of view, then from the share's point of view and finally from the market's potential.
Let's start with Keyence itself, so that we know what we are talking about:
Keyence in facts, figures and dataKeyence's business areas, products and current situation
KEYENCE (= "KEY OF SCIENCE") from Osaka was founded in 1974 and is one of the top 5 companies on the Japanese stock exchange with a market capitalization of 92.19 billion euros. The company achieved sales of 755.2 billion yen in fiscal 2021, with KEYENCE having total assets of 2,324 billion yen. The products are very diverse in the field of machine measurement and mainly include (see (1), (16)):
- Sensor technology
- Products for optics control via AI
- Microscopes
- Process sensors
- And further measuring technology for industrial application also with integration of 3D measuring devices
In addition to this specific product and service portfolio, it is also striking that a total of only 3 companies are larger market capitalized and well-known companies such as Mitsubishi, Softbank or Hitachi are valued much smaller. Looking at the difference of Keyence to Sony, the current difference is 90T JPY according to (4). Sony is valued at JPY 12.96 trillion at the time of this analysis, which is the equivalent of 92.359 billion. Depending on the stock exchange and the exchange rate, the values fluctuate - but all have in common that the gap is not too big (see (2), (3), (4), (5)).
It is 1- ( €92.19 billion / €92.359 billion ) = 1 - 99.82% = 0.183%.
So Sony and Keyence are separated by only 0.183% in market capitalization. This is very close together and highlights that Keyence obviously plays a big role in the Japanese economy. But who is this big relatively unknown player and what makes it stand out?
A search on the homepage of the Japanese parent company helps here. We see that Keyence can boast an equity ratio of 93.5%. That usually speaks for the company's ability to get credit in times of crisis. Why?
A company that is already cross-financed via loans can usually not offer any collateral. This means that the bank has to take a risk and can, if necessary, sit on the loan. This speaks either for no lending or the issuance of money against horrendous interest rates. Especially in times of rising interest rates, a high equity ratio is relatively desirable and the 93.5% is really a good base. It can be particularly important for dividend investors, because equity includes, among other things (see (6)):
- the subscribed capital
- Any reserves
- Profit and loss carried forward
- The net profit for the year
Dividends are (or at least should be) paid from net income. So does Keyence have hammer dividends and is virtually the king among Japanese dividend stocks?
Full of anticipation because of blissful ignorance, one opens e.g. Marketscreener or the stock finder and finds out: 0.56% dividend yield.
A GOOD HALF PERCENT DIVIDEND YIELD! WOW!
A second check on Aktienfinder confirms the tragedy: it really is only dividend yields around the half percent mark, and that despite no reduction for 10 years, a payout on free cash flow of around 23%, and a reduction on earnings of only 17.7%. Absolute dream figures when compared with better-known companies in the dividend world (see (7), (8)).
To keep it reasonably fair, I now deliberately do not compare Keyence with Altria, Coca-Cola or the like, as the business model would be zero comparable. Altria is, in my opinion, arriving as a cigarette company in the cash wow phase just before Poor Dogs, Coke is a standard product and almost 100% acyclic (see Christmas Coke) and the two standard dividend companies do not sell tech products. At most in the Happy Meal *wink*.
Why is Keyence doing this?
Roar from the back row, "Because it's tech!"
That's not entirely wrong, yet my example of INTEL (which I simply find structurally very exciting as well) shows that tech and high dividends are not necessarily mutually exclusive. As my viewers on YouTube should have seen by now, INTEL offers according to (9) a dividend yield of 5.44% with a stability of 99% and no decrease for 30 years. If you close your eyes and listen to these parameters, you might think you are at a cigarette, oil or other dividend company. In fact, INTEL delivers significantly more dividend yield compared to KEYENCE. Why I still see INTEL critically and what dangers there are among other things, you can see in my YouTube video (see (9)).
Up to this point, it should be enough for us to realize that there are other ways than tech companies.
What reason could KEYENCE have for its low dividend yield? They seem to have money, don't they?
It's always a question of corporate structure, which significantly shapes the stock. That means: If I have a perpetual runner that can hardly be improved and with which I can implement moderate price increases, I may be tempted to economize in terms of CAPEX expenses. This means that I do not need money for research and development and instead make it available to the capital market. Additional dividend increases and/or special distributions may also attract new shareholders.
A negative example of this is the TUI share, which I also analyzed here recently. Since money was needed to service loans, among other things, more shares were issued. Mathematically, nothing happens - whether you have 1 share for 10€ or 2 for 5€ each is irrelevant for your final result. But it does matter to the capital market. You can read how he responded and why I am currently critical of TUI in my article.
But the example of TUI shows that growth and stabilization have to be financed by loans - and these loans are currently particularly unfavorable due to the rising interest burden. Money for CAPEX is then rather a secondary matter.
KEYENCE, on the other hand, has a good starting point with the equity ratio mentioned above and no significant net debt. The gearing is even negative with currently -2.35x. This means that the difference between assets and liabilities can be in favor of the assets, which implies negative liabilities. Negative debt is then often assets again (see (10),(11)).
Huh?
You want to buy a kebab and pay the 8€ with your credit card. You still have 10€ on the account. Normal people calculate now: My money = 10€ money in possession - 8€ cost of kebab = 2€. The degree of indebtedness calculates inversely with the indebtedness: Indebtedness = 8€ costs for kebab - 10€ money in possession = - 2€.
In the result you have a negative net debt, because your cash reserves are sufficient to service your debts. If you want to show: This is called "Net Cash Position".
If we now calculate an x arbitrary income factor as pseudo Ebitda against it, we get the ratio of your negative debt to your income. That's why the debt ratio is always given as a multiple.
What does this mean for KEYENCE?
KEYENCE, like you (who should perhaps make different financial decisions regarding kebabs), obviously has more cash on hand than debt and therefore ends up with a negative debt to income ratio, just like you in the example. That wasn't so difficult, was it?
Basically, this simplified explanation is enough to understand the "mystery" of negative debt. Frankly, I plan to follow Capriolensonne's suggestion and produce several shorts. Each just under a minute long on just such questions "Why is this debt negative?", "What is free cash flow?"....
I took a first step in this direction with my short on "What is the S&P 500?" and of course I'm looking forward to your opinions on it. Would you guys want to see this? There are a lot of questions from new users lately and maybe it can help someone.
Back to Keyence: we now know that Keyence is a top 5 company from Japan, it has no significant debt, the gearing ratio may not be a problem and they obviously don't offer a high dividend.
But what do the sales say?
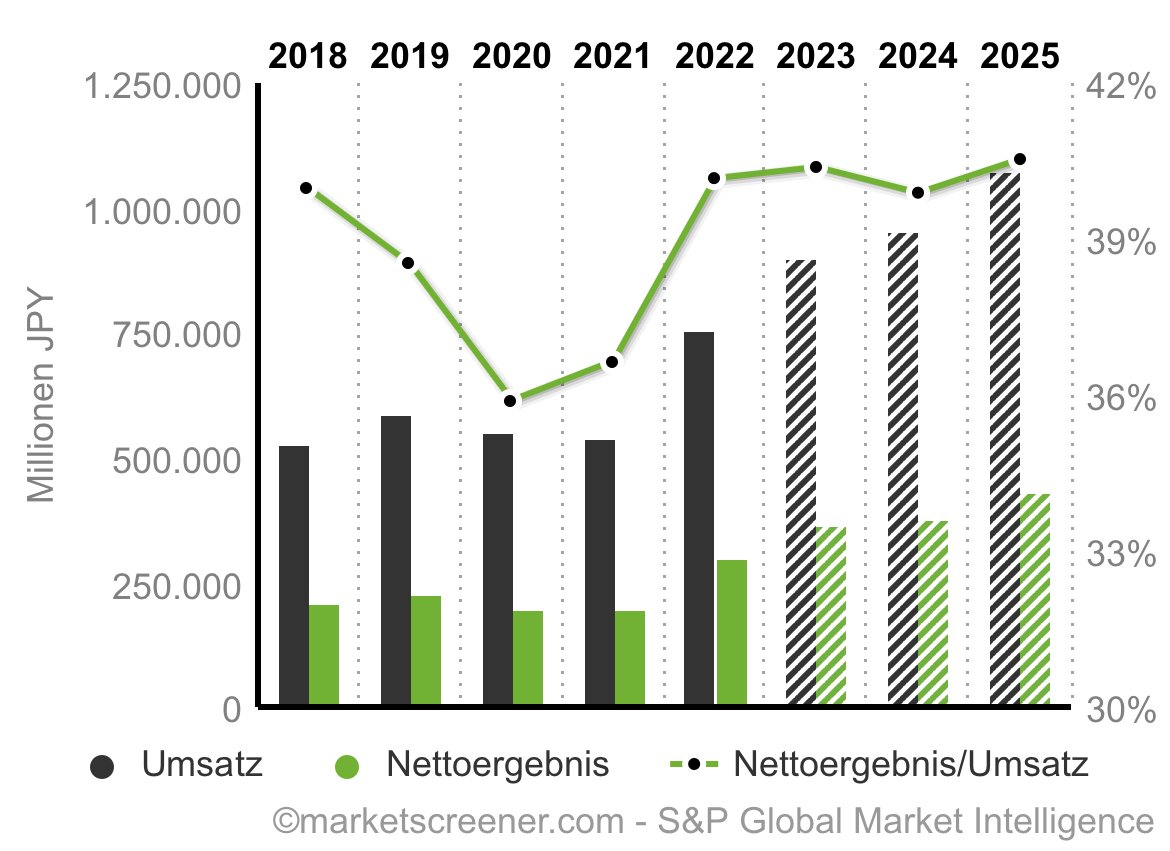
Keyence's revenues have been in a channel between JPY 944.139 billion since 2020 to in 2022 at JPY 1,004.572 billion. That has been 4.916 billion converted for 2022. This is a significant step, and is expected to be as high as approximately JPY 1,796 billion in the future in 2025. Free cash flow is also seen to be on a positive trend and if we compare 2020 with 2025, it is almost a doubling of FCF (see (10)):
195,191 / 350,950 = 55.62% <> 350,950 / 195191= approx. 180%.
So we see that 2020 has just reached 56% of what analysts believe KEYENCE will achieve in the future. An increase of 1.8 times in FCF, which is hardly used for dividends anyway, certainly shows potential. But what bothers me when looking at the figures?
I am mainly disturbed by the fact that equity is increasing, the equity ratio is high, however the return on equity lets us down a bit. It indicates how effectively the management is using the available equity and applies the net result to the available equity.
KEYENCE has achieved values here between 10.7% to 14.8%. As of 2023, these values are between 14.4% to 15.6%. Why do I not like this?
Simple fraction calculation: If the denominator increases, the fraction decreases if the numerator does not increase in the same or higher ratio. This is exactly what happens here. Unfortunately, the net result does not increase in the same proportion. If you look at it, you can see that it does:
2022: JPY 303,360 million
2023: 364,228 million JPY
2024: 381,370 million JPY
...
Nevertheless, the return on equity falls from 14.8% in 2022 to 14.5% in 2024, which is not particularly pleasing as it indicates less efficient management with the available resources (here: equity). For the moment, this may be complaining at a high level - nevertheless, I found this point interesting (see (10), (12)).
In addition to the management, as a shareholder I am always very interested in what my invested money is spent on. I know that sounds rather platitudinous. But would you as a senior pay people to go shopping without having a basic idea of the expected costs?
Accordingly, the return on assets helps us. It puts KEYENCE's net income in this example in relation to its assets. To put it bluntly: "Are they going to buy a golden BMW with my money or are they going to invest profitably in a new warehouse management system?" This is very important, because as an investor you often only have the possibility to browse through larger PDF documents with declarations of intent for the future. This RoA parameter makes the company's investments and their sense transparent to everyone. That's why RoE and RoA are indispensable parts of any stock analysis for me (see (12), (13), (14)).
What are assets anyway?
I reactivate my knowledge from my studies and work for you. There are 4 different asset types. Off the top of my head I call them as follows (cf. (14)):
- Fixed assets
- Current assets
- "Financial assets"
- Intellectual property
Fixed assets are most often a building, equipment, factory or something else tangible with a shelf life of more than one year plus depreciation over time.
Current assets are the short-lived brother of fixed assets and include cash, inventory, and prepaid services less than one year. So, hypothetically, a shipment from one Keyence factory to another with pre-payment and payment advice several months in advance could count as a service belonging to current assets - even though it is intangible.
Also not tangible are intellectual property, which is essentially based on patents, stocks, bonds and such. If KEYENCE owned shares in sister companies, for example, they would be in this column from KEYENCE's point of view. For the other side, of course, it would be different. For company B, the shares issued to KEYENCE would be part of the debt. This for those of you who are interested (see (14)).
What does this mean for KEYENCE now?
RoA is declining for KEYENCE - from its current high of 19.9%, it will be only 69.35% of today's value in 2025 and will be around 13.8% should the analysts be right. Basically, this implies that either assets will increase in a greater proportion than net income or, alternatively, net income will fall.
In KEYENCE's case, we have already learned from the RoE that net income will increase. Thus, a look at the expected assets shows that this will almost double from JPY 1,524.366 billion today to JPY 3,161.557 billion. The aforementioned catalog of asset types will thus become larger, but the net income currently will not. KEYENCE will thus be able to sit on an ever larger mountain of assets, should the analysts be right. What does the company itself say?
KEYENCE itself shows its shareholder data on its Japanese site. Here, certain "financial highlights" are published for the individual annual financial statements. If you look at the operating margins over 50% plus the increasing operating profit, it shows a relatively strong performance of an increase from 2,768 billion yen to 4,180 billion yen. That's more than one and a half times and pretty much a 51.01% increase (see (15)).
Does this situation, which seems fundamentally good for the time being, also have a positive effect on the share?
That's what my second part will be about! :)
I look forward to your feedback and put the videos on Intel and the S&P 500 in the attachment.
Did you like the article? Do you also want to see the stock and market analysis? Then I look forward to your feedback in the comments :)
https://www.youtube.com/watch?v=qZyokxgW_Ds
https://www.youtube.com/watch?v=qDd-Nkqy1dU&t=996s
#aktie
#aktien
#dividende
#dividenden
#aktienanalyse
#keyence
#tech
#japan
Sources
(1) https://www.keyence.co.jp/company/financial-info/
(2) https://www.keyence.de/about-us/corporate/
(3) https://www.finanzen.net/aktien/keyence-aktie
(4) https://de.tradingview.com/markets/stocks-japan/market-movers-large-cap/
(6) https://www.lexoffice.de/lexikon/eigenkapitalquote/
(7) https://de.marketscreener.com/kurs/aktie/KEYENCE-CORPORATION-6492212/
(8) https://aktienfinder.net/dividenden-profil/Keyence-Dividende
(10) https://de.marketscreener.com/kurs/aktie/KEYENCE-CORPORATION-6492212/fundamentals/
(11) https://diyinvestor.de/nettofinanzverschuldung-so-berechnen-wir-net-debt-und-net-financial-debt/
(13) https://billwerk.io/wiki/article/roa-return-on-assets/
(14) https://www.investopedia.com/terms/a/asset.asp
(16) https://www.keyence.de/products/?gclid=EAIaIQobChMIy8jw8ryN_AIVTbTVCh3mEQLFEAAYASABEgIusPD_BwE
Graphics: https://m-de.marketscreener.com/kurs/aktie/KEYENCE-CORPORATION-6492212/
This week looks really red, yet one position made it into the plus. My top 3 positions:
$MAIN (+0.36%) +0,42%
$6861 (+2.56%) -0,14%
$MSFT (-0.88%) -1,58%
3 Keller share:
$EATS -30,17%
$SE (-0.28%) -12,28%
$NB2 (+1.96%) -11,17%
The figures speak for themselves.
Moin, why is the value here in the Kommunity so little noticed ? I see it as very interesting currently. Of course, tech is currently avoided, but.... Or am I missing something ?
Trending Securities
Top creators this week
