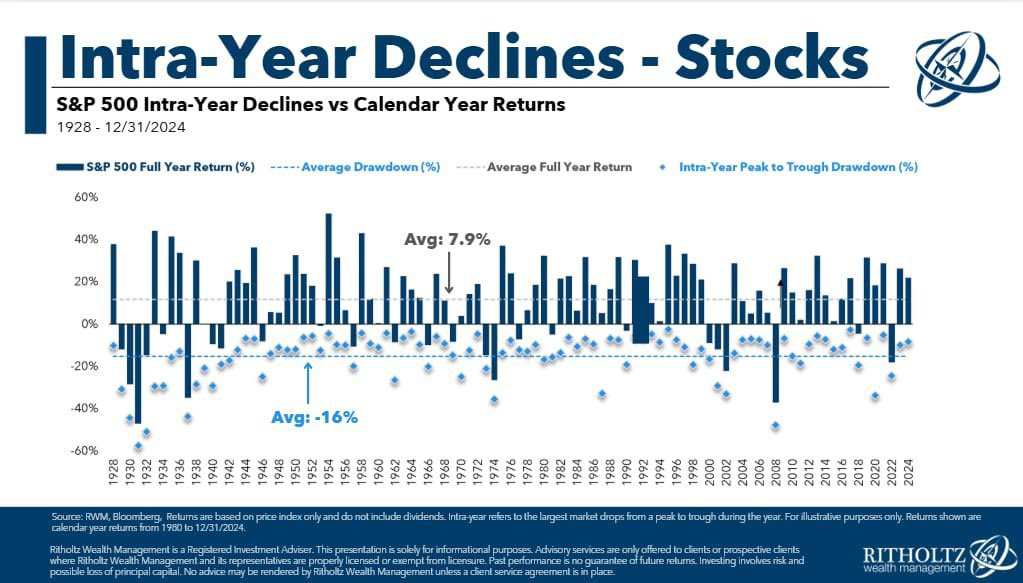
Since 1928, the S& P 500 has seen at least a double-digit decline over the course of the year in 64% of all years
- Markets
- ETFs
- SPDR S&P 500 ETF Trust
- Forum Discussion

SPDR S&P 500 ETF Trust
Price
Discussion about SPY
Posts
67Sector performance & weekly review S&P500
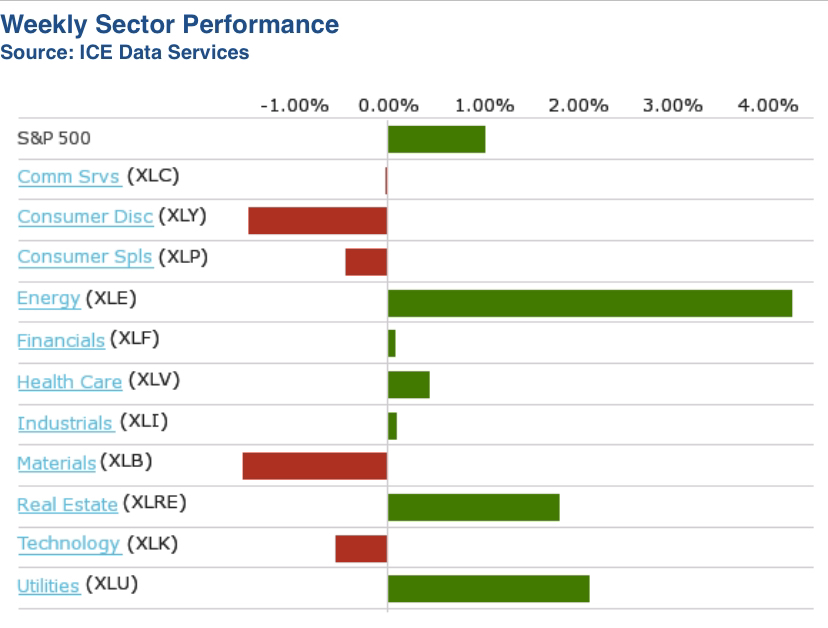
S&P 500 starts 2025 with small weekly loss as materials and consumer stocks weigh
The S&P 500 Index started the new year with a weekly loss of 0.5% as the materials and consumer sectors fell while energy and utilities stocks rose. The index closed Friday's session at 5,942.47 points. The market was closed on Wednesday for the New Year holiday.
On Tuesday, the S&P 500 ended 2024 with an annualized gain of 23%. However, the index fell by 2.5% in December.
Last week, the materials sector recorded the largest decline with a drop of 2.1%, followed by consumer staples with a decline of 1.5% and consumer staples with a loss of 1.4%.
In the materials sector, the shares of PPG Industries (PPG) fell by 5.1%, and Smurfit Westrock (SW) recorded a drop of 3.8 %.
In the consumer goods sector, the shares of Tesla (TSLA) fell 4.9% after the electric vehicle maker announced that vehicle deliveries in 2024 were down year-on-year and fourth-quarter figures missed Wall Street expectations.
In the consumer staples sector, shares of alcohol producers such as Brown-Forman (BF.B) and Molson Coors Beverage (TAP)fell after US Surgeon General Vivek Murthy issued a warning highlighting the direct link between alcohol consumption and an increased risk of cancer and calling for warning labels on alcoholic beverages. Brown-Forman's Class B shares fell 6.6%, while Molson Coors Beverage dropped 4.4%.
The energy sector led the week's winners with a gain of 3.2%, followed by a 1.3% rise in utility stocks.
Devon Energy (DVN) jumped 8.8% after Wolfe Research upgraded its rating on the stock from "peer perform" to "outperform".
Among utilities, the shares of Vistra (VST) rose 16 % after UBS raised its price target for the stock from USD 161 to USD 174.
In the coming week, December labor market data will be in focus, including the monthly employment report from ADP, which is due on Wednesday, and the Labor Department's employment report, which will be released on Friday. Other important data includes November industrial orders (Monday), December consumer credit (Wednesday) and the preliminary consumer confidence index for January (Friday).
A decade of Discontent? Goldman Sachs Throws Shade and Numbers at the S&P 500's Future
$SPY (-0.73%) Goldman Sachs dropped a report in October that's colder than a polar bear's nose!
Their analysts are predicting a serious slowdown for the S&P 500, forecasting an average annual nominal return of just 3%over the next decade. To put that in perspective, the index has been cruising along at a cool 13% average annual return for the past 10 years. Talk about a market mood swing! It's enough to make you want to sell all your stocks and invest in a lifetime supply of ramen noodles (though I wouldn't recommend that, unless you really like ramen).
Why So Glum, Chum? Decoding the Doom and Gloom
So, why is Goldman Sachs suddenly channeling their inner Eeyore? Well, they seem to think the market is currently more overvalued than a beanie baby collection in 2024. (Okay, maybe not that bad, but you get the idea.) Their fancy statistical model, which factors in everything but the kitchen sink, suggests we're headed for a period of "meh" returns.
Here's a peek at the variables swirling around in their crystal ball:
Adding Insult to Injury: Bonds and Inflation Join the Party
To make matters even more interesting, Goldman Sachs says there's a 72% chance the S&P 500 will underperform bonds over the next decade. And wait, there's more! There's also a 33% chance it won't even keep up with inflation. (So, you might end up with a bigger number in your investment account, but it'll buy you less stuff. Kind of like how a bag of chips seems to get smaller every year.)
Want more? read my full analysis with valuation and history analysis in my Substack :
https://waver.substack.com/p/a-decade-of-discontent-goldman-sachs

https://www.goldmansachs.com/insights/articles/the-s-and-p-500-is-forecast-to-return-10-percent-in-2025
Sector performance & weekly review S&P500
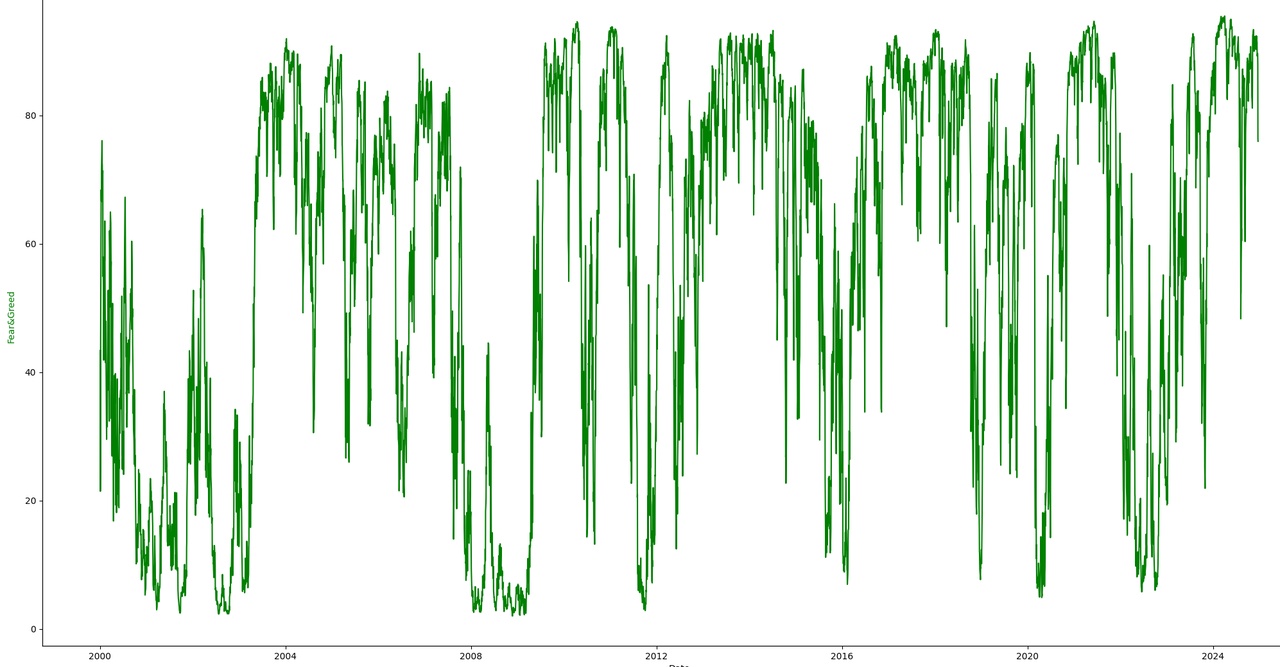
S&P 500 recovers after two consecutive weekly losses, 2024 still up 25%
The Standard & Poor's 500 avoided a third consecutive weekly loss, rising 0.7% and extending its year-to-date gains to 25% with two trading days left in 2024.
The benchmark index closed Friday's session at 5,970.84 points, up from the previous week's close of 5,930.85 points. The S&P 500 reached its all-time high of 6,090.3 points on December 6. The last trading day of the year is Tuesday.
"Investor sentiment is high entering 2025 as several positive trends from 2024, which are still in place, have been reinforced by the results of the US presidential election in November. These have raised expectations of pro-growth policies," D.A. Davidson explained in a note to clients on Friday. "This creates conditions for equity prices to continue to rise if US economic growth remains above 2% and corporate earnings grow by more than 10%."
The effect of a so-called "Santa Claus rally" in the US stock market could be reversed early next year by the prospect of new trade policies or tariffs under the new Trump administration, Saxo Bank said in a report published this week. The Santa Claus rally describes the tendency of stock markets to rise in the last week of December and the first two trading days of January.
US markets were closed on Wednesday for Christmas. According to preliminary data from a Mastercard report, retail sales rose more than expected during the holidays, outpacing last year's growth.
Among sectors, energy and healthcare were the week's best performers, each rising more than 1%. Only consumer discretionary and materials posted losses.
In healthcare, the US Food and Drug Administration (FDA) announced that it is proposing a rule that would introduce and require standardized testing methods to detect asbestos in cosmetic products containing talc.
The technology sector posted a weekly gain of 0.9%, helped by some key semiconductor stocks, including Broadcom (AVGO), which jumped 9.5%, and AI chip favorite Nvidia (NVDA), which rose 1.7%.
The financial sector also posted a weekly gain of 0.9%. Some US banks and business associations filed a lawsuit against the Federal Reserve, criticizing a "flawed" stress test procedure.
The consumer sector rose 0.5%, driven by a 4.9% jump in coffee chain Starbucks (SBUX), whose employees returned to work on Wednesday after a five-day strike. Electric vehicle maker Tesla (TSLA) posted a weekly gain of 2.5%.
In the area of everyday consumer goods, the US Consumer Financial Protection Bureau (CFPB) filed a lawsuit against retail giant Walmart (WMT) and fintech company Branch Messenger. It accused them of forcing delivery drivers to use expensive deposit accounts in order to get paid. Walmart recorded a weekly decline of 0.6 %.
Next week's economic calendar includes December US manufacturing data from the Institute for Supply Management and S&P Global. Reports on pending home sales for November and home price data for October are also expected. The markets will be closed on Wednesday for the New Year.
Fear and Greed Index
I would like to tell you about my little project that has kept me busy over the last month :)
I'm a fan of sentiment indicators and I'm sure everyone here is familiar with the CNN Fear and Greed Index(1)
This index uses various indicators to determine how fearful or greedy market participants currently are.
However, there is not really any data going back very far, which is why I have created my own Fear and Greed Index. Firstly, it goes back to 2000 and secondly, it consists of more indicators that can be weighted manually.
This is my favorite weighting:
Which indicators are used?
The CNN Index uses the following:
(All "companies" always refer to S&P 500 $SPY (-0.73%) companies)
- S&P500 Momentum (S&P500 $SPY (-0.73%) Index against its 125 EMA)
- Stock Price Strength (companies at 52-week high vs 52-week low)
- Stock Price Breadth (volume of companies with price gains vs price losses)
- Put-call ratio (number of put vs. call options)
- Market Volatility (VIX $VIX vs 50 day EMA)
- Safe Haven Demand (Price Gains vs Bond Yields (10Y))
- Junk Bond Demand (Spread between Junk Bonds vs Treasury Yields)
I also use these indicators, including the following additional ones:
- University of Michigan: Consumer Sentiment (consumer sentiment survey)
- AAII Investor Sentiment (investor sentiment survey)
- Margin Debt Ratio (measures investment purchases on credit (leveraged positions))
- Insider Transactions (insider buying vs insider selling)
- 10Y Treasury Yield (coupon of the 10-year US bond)
- YieldCurve (Coupon of the 10Y - Coupon of the 2Y US bond)
the following indicators signal greed (higher values => greed):
- S&P500 $SPY (-0.73%) well above 125 EMA
- Stock Price Strength (many companies at annual high vs. annual low)
- Stock Price Breadth (high volume on price gains)
- Safe Haven Demand (high price gains vs bond yields)
- Consumer Sentiment (good consumer sentiment)
- AAII Investor Sentiment (bullish investor sentiment)
- Margin Debt Ratio (high and highly leveraged positions)
- 10Y Treasury Yield (can also indicate a weak current situation in a recession, but I opted for the long-term positive outlook, which is indicated by a high yield)
the following indicators signal Fear (higher values => Fear):
- Put-call ratio (more bets on falling prices)
- Market Volatility (more volatility expresses nervousness)
- Junk bond demand (higher risk premium for junk bonds)
- Insider Transactions (higher BUYs as a signal of fear, as smart money is considered here. The highest buy/sell ratios were seen during recessions)
- YieldCurve (higher spread than a signal from Fear, often in recessions when short-term prospects are extremely poor, but in general I didn't find the indicator very good, which is why I no longer have it in the final version)
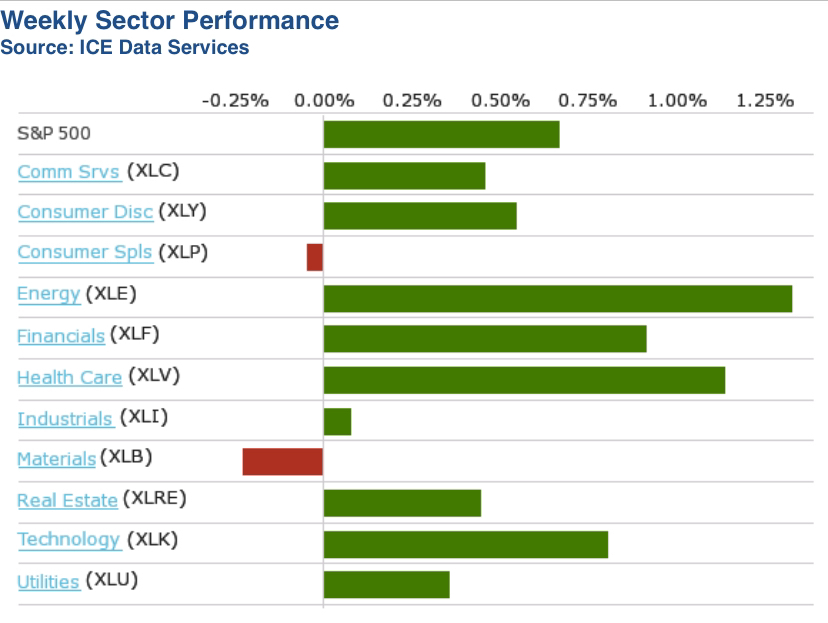
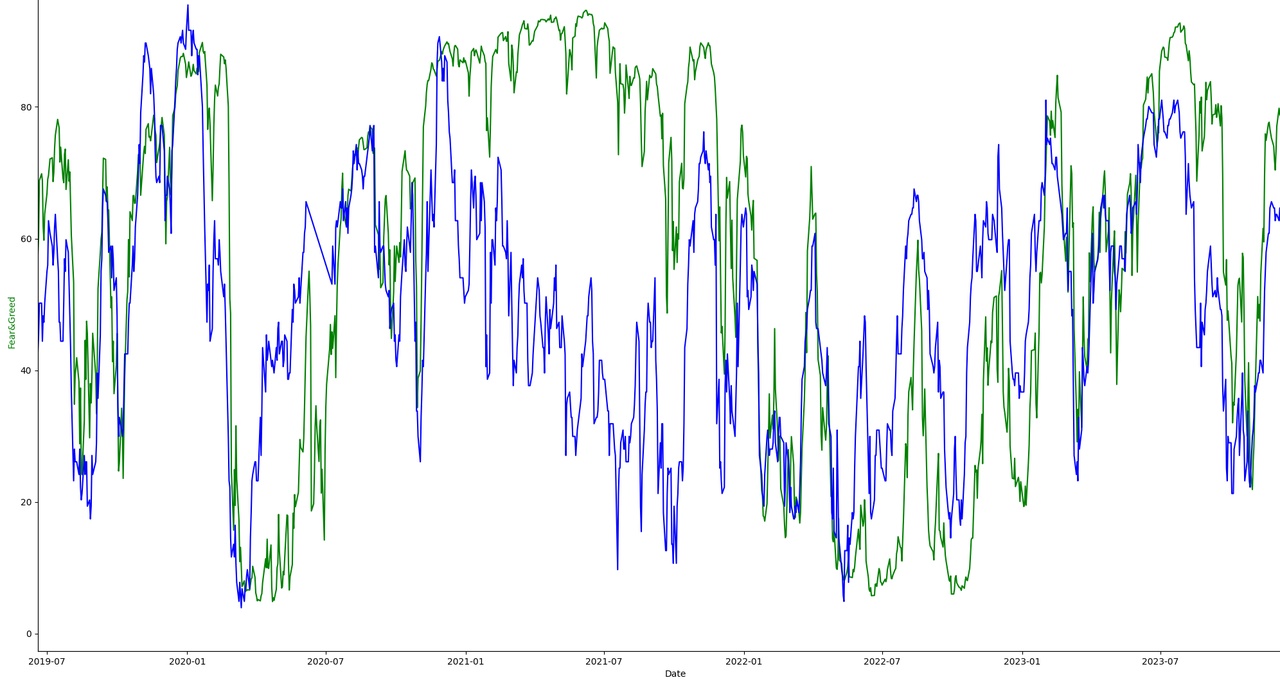
There is data that is available daily, while I only have access to others after 2 months, which is why my index generally lags behind CNN's Fear and Greed (CNN in BLUE, mine in GREEN):
(here I find CNN's index way too low in the 2021 tech boom period)
Currently, there is also a big divergence. While the CNN index has plummeted to 30 from 67, my index is still at 75 from 94.
I've been thinking about training an AI model that calculates a good investment strategy for me and optimizes the return or the Sharpe ratio (risk-adjusted return), for example. Here you could train on different ETFs. However, this will probably lead to overfitting (the model learns exact values from the past and not general strategies). Overfitting could perhaps be reduced somewhat by training on a random index, so the model has to find a strategy that can cope with a random ETF.
In general, it should be noted that the Fear and Greed Index only covers the US market. It probably works best on US indices $SPY (-0.73%)
$CSNDX (-1.23%) but global strategies should also work well, as the US share is usually over 60% $IWDA (-0.8%)
$ACWI . Europe or EM probably have a slightly lower correlation $EXSA (-0.76%)
$EIMI (-1.1%)
Nevertheless, the US dominates the world and therefore a US sentiment index should also be a global sentiment index.
Maybe I'll make the index publicly available, we'll see.
Now it's your turn:
What would interest you in connection with this index?
What could be done differently, added, etc.?
I wish you all a Merry Christmas🌟🎄🌟
Sector performance & weekly review S&P500
S&P 500 falls for second week in a row, energy leads broad-based decline
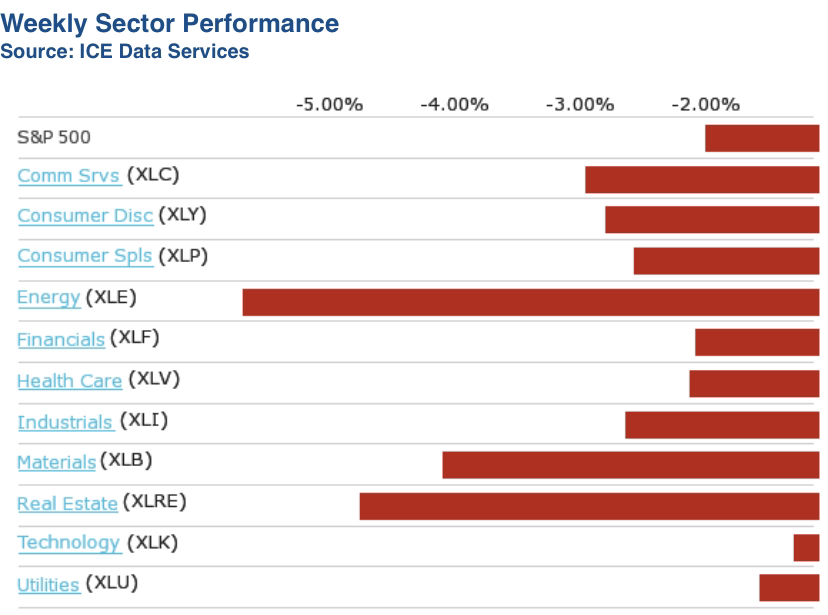
The Standard & Poor's 500 Index fell 2%, dropping for the second week in a row, triggered by concerns about the Federal Reserve's future monetary policy and a possible government shutdown.
The market index closed the week at 5,930.85 points and is now down 1.7% in December, but remains well in positive territory for 2024 with a year-to-date increase of 24%.
On Wednesday, the Federal Open Market Committee (FOMC) cut the central bank's key interest rate by 25 basis points, as expected. However, the monetary policy committee signaled fewer interest rate cuts in the coming years than previously assumed and at the same time raised its inflation forecasts. Inflation, as measured by personal consumption expenditure (PCE), is now estimated at 2.4% for this year (previously 2.3%) and 2.5% for 2025 (previously 2.1%). These developments fueled concerns among investors and weighed on share prices.
In addition to these concerns, a possible government shutdown loomed after a bipartisan agreement on funding until mid-March failed last week and a budget bill proposed by Republicans in the House of Representatives for three months of funding was not passed late on Thursday.
All sectors of the S&P 500 posted weekly losses, led by a 5.6% decline in the energy sector, followed by a 5% drop in the real estate sector and a 4.2% decline in the materials sector. Other sectors with declines of at least 2% were industrials, consumer discretionary and defensives, healthcare, communications services and financials.
In the energy sector, the shares of Phillips 66 (PSX) recorded the biggest loss, falling 10% for the week. The company announced the sale of DCP GCX Pipeline, which holds a 25% non-operating interest in the Gulf Coast Express Pipeline, to an affiliate of ArcLight Capital Partners for pre-tax proceeds of $865 million in cash, subject to adjustments.
In the real estate sector, the shares of VICI Properties (VICI) fell by 7.5 % after KeyBanc downgraded the rating from "overweight" to "sector weight". In addition, VICI Properties announced that its subsidiary VICI Properties LP completed a public offering of USD 750 million of unsecured senior notes with an interest rate of 5.125% and a maturity date of 2031.
In the materials sector Nucor (NUE) and Steel Dynamics (STLD) were among the losers as both steel producers announced fourth-quarter earnings below analysts' expectations due to lower prices. Shares of Nucor fell 6.9%, while Steel Dynamics lost 5.5%.
In the coming week, the markets will close three hours early on Tuesday, December 24, and remain closed on Wednesday for Christmas. Due to the holiday-related closures, there will be few economic data releases, including December consumer confidence on Monday, November durable goods orders and new home sales on Tuesday, weekly initial jobless claims on Thursday and November merchandise trade balance on Friday.
Sector performance & weekly review S&P500 | $SPY (-0.73%)
S&P 500 ends weekly winning streak as materials and utilities weigh
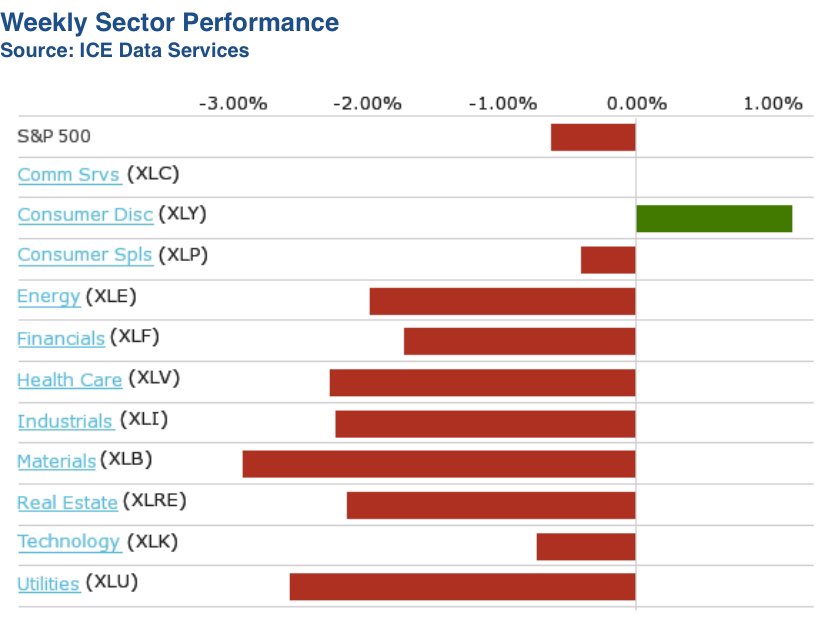
The S&P 500 index fell 0.6%, its first weekly decline since mid-November. The market index ended Friday's session at 6,051.09 points. This broke a three-week winning streak, but the S&P 500 is still well up for 2024 with a year-to-date gain of 27%.
This week, data showed that the US Consumer Price Index (CPI) rose by 0.3% in November after increasing by 0.2% in each of the previous four months. Year-on-year inflation accelerated to 2.7%, compared with 2.6% in October. Both figures were in line with the forecasts of a survey compiled by Bloomberg.
Producer prices for November, however, rose more than expected as wholesale costs for goods increased due to a rise in food prices. The US Producer Price Index (PPI) rose by a seasonally adjusted 0.4% month-on-month in November, compared to the consensus estimate of a 0.2% increase. Year-on-year, producer prices rose by 3%, exceeding the expected 2.6%.
Investors are watching the inflation figures closely as the Federal Open Market Committee (FOMC) of the US Federal Reserve will make its final interest rate decision of the year next week.
The materials sector posted the largest percentage decline among the S&P 500 sectors, with a weekly drop of 2.9%, followed by a 2.7% decline in the utilities sector and a 2.4% loss in the real estate sector.
In the materials sector, shares of Nucor (NUE) were the hardest hit, falling 12%. UBS downgraded the stock from "buy" to "neutral" and stated that there is "limited upside potential" for the stock in the short term. The company also lowered its price target for Nucor shares from USD 171 to USD 156.
In the utilities sector, Pinnacle West Capital (PNW) shares fell 4.4% after the company announced that Pinnacle West and Arizona Public Service Chairman and CEO Jeff Guldner will step down effective March 31. Ted Geisler will become Chairman, President and CEO of Pinnacle West and Arizona Public Service effective April 1.
Nevertheless, communication services increased by 2.4 %, while the non-cyclical consumer goods segment grew by 1.4 %.
In the communications services sector, shares of Warner Bros. Discovery (WBD) rose 13% for the week after the company announced plans for a restructuring. Warner Bros. Discovery plans to introduce a new corporate structure that will split its operations into two divisions: "Global Linear Networks", which will focus on profitability and cash flow, and "Streaming & Studios", which will target growth through streaming and entertainment.
The upcoming FOMC meeting will take center stage next week. Important economic reports are also expected, including the second revision of third quarter gross domestic product (GDP), US retail sales for November and data on housing starts and building permits.
S&P500 sector performance and weekly review $SPY (-0.73%)
S&P 500 starts December with a weekly rise to new highs, led by consumer discretionary
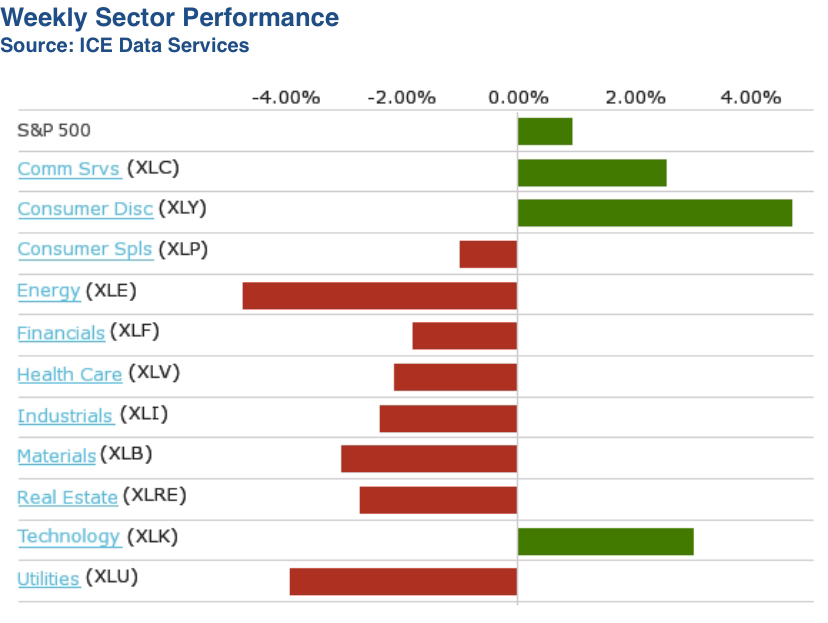
The S&P 500 index rose 1% this week and reached new highs, driven by gains in the sectors consumer discretionary, communication services and technology.
However, the other eight sectors of the S&P 500 recorded weekly losses. Nevertheless, the market index closed Friday's session with a new closing record of 6,090.27 points . Over the course of the day, the index even reached a new intraday high of 6,099.97 points and has recorded an increase of almost 28 %.
Drivers of the increase
- Consumer discretionary (+5.9%): This sector recorded the strongest rise of the week, mainly thanks to retailers Lululemon Athletica (+25%) and Ulta Beauty (+11%)which both reported better-than-expected quarterly results and raised their full-year forecasts.
- Communication Services (+4.1%): Meta Platforms (META) increased by 8,6 % after a US federal appeals court upheld a change in the law requiring TikTok to divest its US operations by January 19. January 19 January 19. Meta could benefit from this as Facebook and Instagram compete with TikTok for users and advertising revenue.
- Technology (+3.3%): Super Micro Computer (SMCI) increased by 35 %after it was announced that the company had been acquired in connection with Elon Musk's xAI project "Colossus" to provide hardware for a new data center project in Memphis, Tennessee.
Loser of the week
- Energy sector (-4.5 %)The decline is due to falling crude oil futures after OPEC+ decided to extend voluntary production cuts while the market is expected to be oversupplied. Losers included Texas Pacific Land (-16 %) and Halliburton (-9.7 %).
- Utilities (-3.8 %), Materials (-3 %) and real estate, industry, Healthcare, finance and consumer goods for daily needs also recorded losses.
Labor market data
On Friday, US economic data showed that the nonfarm payrolls rose by 227,000 jobs in November (expected: 220,000). The unemployment rate rose to 4.2% (previously 4.1%), while the labor force participation rate fell to 62.5 (previously 62.6 %).
Outlook for next week
Important economic data is due in the coming week, including the Consumer Price Index (CPI) for November on Wednesday and the Producer Price Index (PPI) for November on Thursday. In addition, quarterly reports from companies such as Oracle (ORCL), Adobe (ADBE), Broadcom (AVGO) and Costco (COST) expected.
Sector performance & weekly review S&P500 | $SPY (-0.73%)
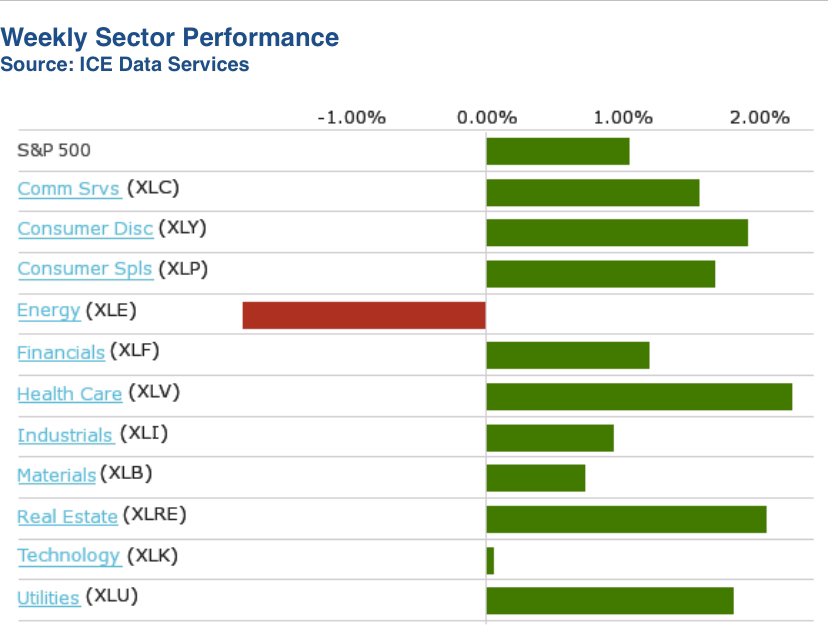
S&P 500 posts weekly rise to new record high and ends November with strongest monthly gain of the year
The Standard & Poor's 500 Index rose 1.1% in this holiday-shortened week, ending November on a strong note. The market benchmark achieved its largest monthly gain of the year.
The S&P 500 closed the shortened trading session on Friday at 6,032.38, the highest close in its history, a day after closing for the Thanksgiving holiday. Friday also saw a new daily high of 6,044.17.
Month-on-month, the S&P posted a gain of 5.7%, the biggest monthly increase since an 8.9% jump in November last year. The index is up 26% so far in 2024, with one month remaining.
Economic data this week showed that U.S. real gross domestic product (GDP) grew at an annualized rate of 2.8% in the third quarter, in line with both the previous estimate and the consensus compiled by Bloomberg. However, the measure of personal consumption expenditure was revised downwards from a previously forecast 3.7% to growth of 3.5%.
All but one sector of the S&P 500 rose this week. The consumer discretionary sector posted the largest percentage gain with a 2.3% increase, followed by a 2.1% increase in the healthcare sector and a 2% increase in the real estate sector.
Among the gainers in the consumer discretionary sector was a 14% rise in shares of Ulta Beauty (ULTA) as the cosmetics retailer prepares to release its third quarter results. Ahead of the announcement, Citigroup raised its price target on the stock from USD 345 to USD 390.
In the healthcare sector, Eli Lilly (LLY) shares rose 6.3% after its diagnostic drug flortaucipir (Tauvid) received approval from the UK's medicines regulator to test for Alzheimer's disease in adults with memory problems.
In the real estate sector, Equinix (EQIX) shares rose 4.8% after the company announced it would issue an additional 1.15 billion euros ($1.21 billion) worth of green bonds. Truist Securities raised its price target for the stock from USD 935 to USD 1,090.
The energy sector was the only loser of the week, falling by 2%. Crude oil futures also fell as the conflict between Israel and Hezbollah eased and concerns over supply disruptions eased.
Among the losers in the energy sector were shares of Diamondback Energy (FANG), which fell 4.2%, and Devon Energy (DVN), down 3.8%.
Next week, the market will kick off December with reports on construction spending in October and manufacturing data in November. However, the main focus will be on the November labor market data, which will be released later in the week.
The S&P 500 officially posts its best monthly performance in 12 months. $SPY (-0.73%)
The S&P 500 closed the month nearly 6% higher, adding more than the last 4 months COMBINED.
This marks the largest monthly gain since the 9% seen in November 2023, after the market began its historic run.
Since the October 2023 low, the S&P 500 has rallied a whopping 47% and is on track for the 2nd straight 25%+ annual return.
At the same time, the index also crossed above $50 trillion in market cap for the first time.
The strength of this market is truly historic.
The S&P 500 just hit its 53rd all time high of 2024 and is currently up over 27% this year ALONE.
This puts the S&P 500 on track for 2 STRAIGHT years with 20%+ gains for the first time since 1998.
Trending Securities
Top creators this week


