Smart Beta ETF
Part 1 What is Smart Beta & Quality ETF
Reading time: 8-10 minutes
Table of contents
- What is a smart beta ETF?
- Categories of Smart Beta ETF?
- Z-Value
- Methodology Quality ETF
- Conclusion and outlook
Disclaimer: No investment advice or recommendation, this article is for information purposes only. Before you decide on an ETF, take a closer look at it in terms of positions, sampling, regions, etc. I can't describe everything here as it would go beyond the scope of this article.
What are smart beta ETFs?
To understand smart beta ETFs, it is first important to know what "beta" is. Beta is a financial ratio that measures how much an asset/share (or a group of shares) fluctuates in relation to the underlying market. Simplified: if the German stock market has a volatility of 16 % and the DAX of 10 %, then the beta is 1.6.
The reference value for the beta is therefore the market. For "normal" ETFs, the beta should be close to 1, as the iShares Core MSCI World ($IWDA), for example, attempts to replicate the MSCI World Index and both are weighted according to market capitalization (not quite 1 due to tracking difference).
In contrast, smart beta ETFs attempt to achieve a higher return or lower risk (volatility) by selecting a different stock from the underlying market capitalization-weighted index (beta), e.g. by equal weighting or applying certain parameters such as price/earnings ratio or price/book ratio.
In addition to smart beta, there are also terms such as "tilt" or "enhanced" for this "smart" stock selection, i.e. the determined over- or underweighting of various characteristics.
Smart beta ETF categories
Roughly speaking, smart beta ETFs can be divided into the following categories:
- Quality (approx. 12 billion invested volume)
- Value (approx. 12 billion invested volume)
- Low Volatility (approx. 8 billion invest volume)
- Momentum (approx. 4 billion invest volume)
- Multi-factor
- Growth & Small-Cap (approx. 12 bn Investvol)
- Dividend (approx. 16 bn Investvol.)
- Equal-Weight
Even if one or the other strategy has been mentioned several times before, it is surprising that the investment volume of all smart beta ETFs is lower than that of the $IWDA (-0.86%) (EUR 73 bn)
So what is the approach behind the individual smart beta ETFs and could this present an interesting investment opportunity? To find out, let's take a look at the individual tilts and their methodology.
The Z-value
In order to understand the methodology of Smart Beta ETFs, it is necessary to deal with the so-called Z-value, as MSCI in particular seems to have fallen in love with this parameter for its Smart Beta ETFs.
The Z-value is a figure that shows the number of standard deviations of a data point (e.g. P/E ratio) from the mean value. In this respect, it is a ratio that compares the key figure of an individual stock with the key figures of all stocks in the index.
Simplified example based on P/E ratio
Share A: 10
Share B: 15
Share C: 20
Share D: 50
Mean value: 24
Standard deviation: 15.67
Z-value A: -0.88 (read: P/E ratio of 10 is 0.88 standard deviation below the mean)
Z-value B: -0.56
Z-value C : -0,24
Z-value D: 1,69
If the ETF now wants to overweight shares with a low P/E ratio, for example, it would weight the shares with the lowest Z-value higher.
If you are still stumped by this example - like a clumsy fireman - we recommend the following video:
z-Standardisierung (z-Transformation)- Einfach erklärt - DATAtab
Now to the individual categories, each showing a selection of the largest ETFs:
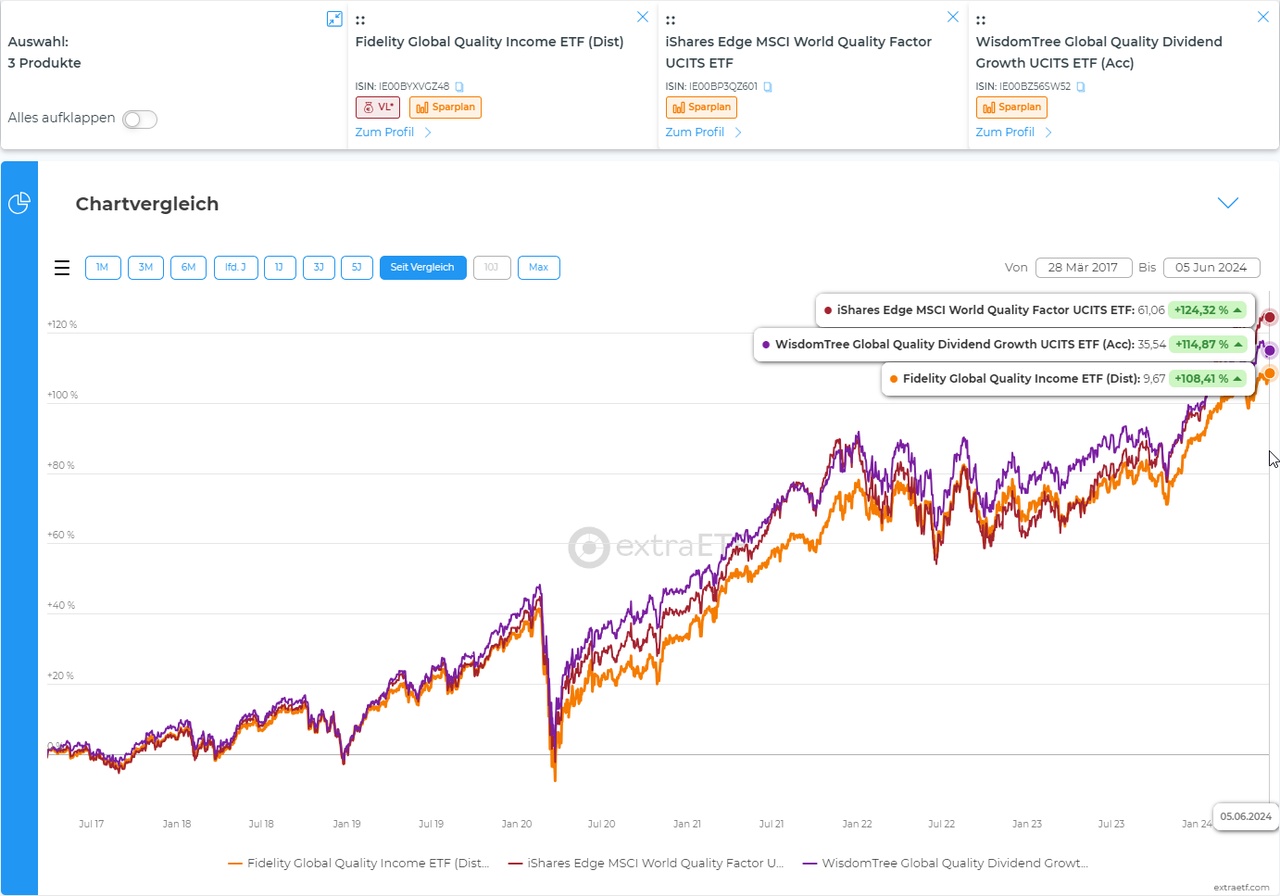
Quality ETF
Overweighting of companies with solid fundamental indicators such as high return on equity, stable earnings growth and low debt.
💰 Z-Score MSCI Quality ETF
There are 4 larger ETFs with the same methodology but focusing on different regions (TD = tracking difference):
- $IS3Q (-0.9%) (World | TER 0.30 % | TD 0.10 % | 3.5 bn Invest | 3Y outperformance vs World + 1,5 %.)
- $IUQF (-0.74%) (World | TER 0.25 % | TD 0.04 % | 1.7 bn | 3Y outperf. vs. world + 1,7 %.)
- $XDEQ (-0.7%) (USA | TER 0.20 % | TD n.a. | 1.9 bn | 3Y outperf. vs. S&P 500 + 0,3 %.)
- $IEFQ (-1.03%) (Europe | TER 0.25 % | TD 0.0 % | 3Y underperf. vs. Eurostoxx 600 - 4,1 %).
Index methodology:
- The ETFs are based on respective "parent indices", e.g. the MSCI World.
- In the first step, the variables are named for the quality ETF:
- Return on equity (12-month earnings per share [EPS] / latest book value per share [BVPS])
- Leverage ratio (total debt / book value)
- Stable earnings growth (measured by variability [standard deviation] of y-o-y eps for the last 5 years)
- The Z-value (see above) is determined for each share for the individual key figures
- Extreme values are then eliminated
- The Z-values are then added together for each share
- The shares with the highest total Z-scores are included in the ETF
- Rebalancing takes place every six months
On a site note: if you want to save some TER, you can use the Xtrackers ETF, these are usually 0.05% TER cheaper than the iShares counterpart with a similar tracking difference & are based on the same index & calculation logic.
💰 Wisdom-Tree-Quality-ETF
Track dividend payers with higher growth prospects at the same time
$GGRG (-0.77%) (World | TER 0.38 % | TD 0.32 % | 0.7 bn | 3Y Underperf. vs. World -2 %.)
$DGRG (-0.33%) (USA | TER 0.33 % | TD 0.02 % | 0.4 bn | 3Y outperf. vs. S&P 500 + 7,1 %.)
Index methodology:
- Variables:
- Growth factor: based on expected earnings growth (expectet eps)
- Quality factor: based on the last 3 years return on equity (ROE) and return on assets (ROA)
- Stability factor: earnings per share (EPS) must be higher than dividend per share (DPS)
- Exclusion criterion: Companies that do not meet Wisdom-Tree's ESG criteria are excluded
- Weighting: After the variable filter, the companies in the index are weighted according to the annual dividends paid
- Rebalancing takes place every six months
💰 Invesco RAFI Index:
- $PFT (-0.63%) (USA| TER 0.39 % | TD 0.33 % | 0.5 bn | 3Y underperf. vs. S&P 500 - 2,7 %.)
- $PEH (-1.46%) (EM | TER 0.49 % | TD n.a. | 0.04 bn | 3Y Outperf. vs. Emerging Markets IMI + 10,8 %.)
Index methodology:
- Variables:
- Cash flow, sales & dividends: Weighting from average values of the past 5 years and current book value
- The index weights are determined in proportion to the fundamental values of the companies. Calculation: fundamental values / market-capitalized free-float values.
Conclusion on the Smart-Beta Factor Quality
In the first part of this series, we looked at quality ETFs. The smart component consists of screening the stocks contained in the "parent index" according to quality factors such as earnings growth, leverage, book value, etc. and weighting them on the basis of their relative strength compared to the other stocks contained in the index.
If you want to track the world index, I would recommend the $XDEQ (-0.7%) However, the difference to the normal MSCI World is not so great that one could speak of real diversification.
I also find the smart beta approach exciting in order to set the focus of the smart beta ETFs differently on geographically different markets (e.g. USA Large CAP/Momentum, Europe: USA Large CAP/Momentum, Europe: Small CAP & Growth, Emerging Markets: Quality & Value). Unfortunately, the only Emerging Markets Quality ETF has a very low investment volume of only around EUR 40 million. Those for whom this is not an obstacle are welcome to take a look at the $PEH (-1.46%) as it has clearly outperformed the MSCI Emerging Markets and, in my view, quality factors can make good use of their opportunities, especially in such markets.
In the next parts, we will look at the other classes of smart beta investing - stay tuned!


