6Mo·

Hi Guys,


once again something to brainstorm about. Some people probably find it difficult to make decisions about various share purchases. Maybe sometimes it's not so important when you buy a stock that you find interesting, but when you don't buy it, when not to buy it. Quasi rational hedging of Fomo purchases. Assuming that there is always a growth and investment thesis and factoring out a few bankruptcies, I make the following 2 assertions. There will definitely be pros and cons here:


Assertion 1:


The 200 DMA is the approximate fair value of a stock. It acts like a magnet, stocks that run far above or below it tend to return to the line sooner or later. (shown in the screenshot in gold)


A share that is well above the 200 level becomes unattractive to buy (although you could continue to hold it). (You could still hold it, however, but a "hold" is not included here). The assertion would thus encourage hasty purchases of e.g. $CMG (-2,32 %)
$DECK (-1,44 %)
$UBER (+0,02 %)
$PSTG (-0,92 %)
$CRWD (-1,52 %)
$AMD (-0,7 %)
$AXON (-1,26 %) that are on my watchlist. What would I do in the case of Chipotle? I would wait until the stock returns to the 200 DMA.


Assertion 2:


Good times to buy are ALWAYS when the Weekly RSI is below 55 (preferably even below 50) and at the same time still below the average line (marked red in the screenshot)


You almost never hit the low when buying anyway. Nevertheless, you would buy your desired stocks close to the lows with a clear conscience and follow a clear line.


Now one or two people might say "but that's obvious". Then I say, it's not that clear. You only have to look at the Getquin timeline. Stocks with an RSI above 60 or 70 and well above the 200s are regularly requested here and considered good buys.


What do you think?

Does anyone act similarly?

Are the claims bullshit?
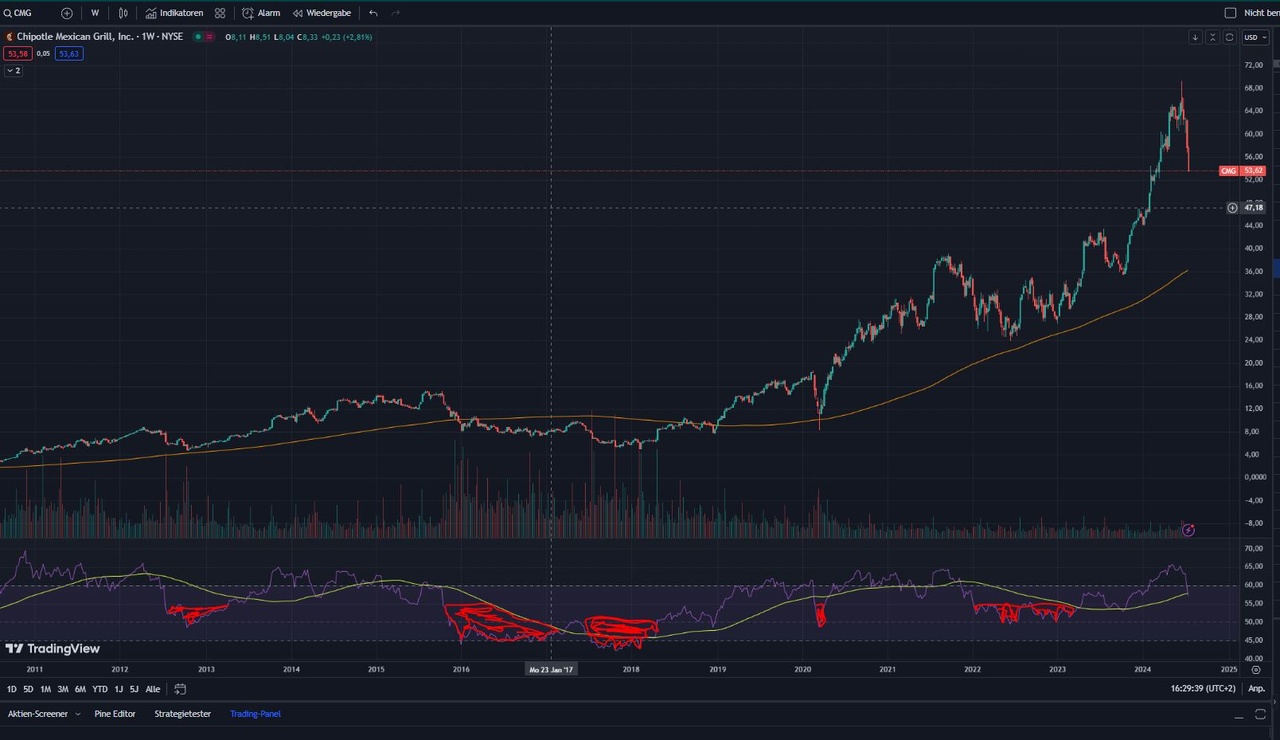
attachment
11
14 Commentaires

image de profil
Sounds interesting, but I would never rely purely on technical analysis - even if it can be helpful in finding a suitable entry point.
However, you should never rely purely on it and always pay attention to macroeconomic factors as well. Otherwise I think you can quickly burn your fingers.
4
image de profil
@stefan_21 That's true. Of course, it can never be ruled out. But I think you can reduce the probability of "hasty" purchases :D
1
image de profil
In the case of indices such as the S&P 500, prices around (or well below) the EMA 200 (or EMA 50 in the weekly chart) are always clear opportunities for me to make larger individual purchases. I also like to buy when the EMAs are tested from above.
Accordingly, when prices are well above the EMAs, I generally only buy via my regular savings plans and even reduce the amounts if necessary.

This also applies to individual stocks that I am absolutely convinced of as a long-term investment, such as $BRK.B.

The last purchases made according to this scheme have performed very well so far.

I have not yet paid attention to the RSI, but it is definitely worth considering 👍
1
image de profil
@ChrisBizz yes, you can always see how the indices bounce off the EMA again and again, which is bull market territory. Only in bear markets every 25 years are the indices below it for a longer period of time. I think there is also an investment strategy where you are only invested when you are above the EMA. But I don't know what it's called at the moment :D
1
image de profil
@Dirty30 Yes, I've read about that too: When the price rises above the EMAs, you invest in a leveraged ETF on I think the S&P 500 or Nasdaq 100 and stay in as long as the price remains above the EMAs. But unfortunately I missed the last entry (I think it was in October 2023) 🤷‍♂️
1
image de profil
@ChrisBizz then keep an eye out next time :D
1
image de profil
Hmmm...I'm not getting along with your RSI right now...do you have any settings other than the default from Tradingview? 🤔
image de profil
@Lika ne should normally be the one on a weekly basis
image de profil
@Dirty30 Thanks for the reply, but my default RSI is somehow completely different.
Could you please look up what I have wrong if it's not too much trouble?

Input:

RSI Settings:
14+Close

MA Settings:
SMA+14+2

Calculation:
1 week

Style:
Upper Band 70
Middle Band 50
Lower Band 30

Could it be that your middle band is set differently? Because mine is pointing downwards and yours is pointing upwards.

I don't understand why this is the case. My RSI is currently showing 40.43.

💝
image de profil
@Lika I'll have a look at it later when I'm online
1
image de profil
@Lika I haven't found anything else https://ibb.co/fpZb6m4
image de profil
Ok, thank you very much. I have now set it up like this...then it matches your RSI. But I'm not sure if this is correct. I'll have to do some research, as RSI is actually set at 14 days everywhere. And very roughly, they say that if the stock goes above 70, it's overbought and below 30 it's oversold...so you have completely different parameters in there. But the way you wrote it in your post could possibly make sense. In any case - thanks for your effort 👍🌞
image de profil
@Lika no problem. I didn't change anything there either, that was my basic settings, so to speak
image de profil
Finviz gives you a good overview
Participez à la conversation